Source Code of Algorithms
The source code is available in GitHub (https://github.com/takanori-fujiwara/streaming-vis-pca).
Source Code for Performance Evaluation
The source code to reproduce the results in the paper can be downloaded here: [download].
Section 3.2: Preserving the Viewer’s Mental Map (related with Fig. 2)
(a) Without the geometric transformation
(b) Our method
Video 1: Comparison of the incremental PCA results for the Iris dataset (a) without and (b) with the geometric transformation and the staged animated transitions. Colors of the points represent the Iris species. For each step, two points, highlighted with blue, are added.
Section 3.3: Position Estimation for Dealing with the Non-uniform Numbers of Dimensions (related with Fig. 4)
Video 2: Visualizations with the position estimation and the mental map preservation. The bus transportation dataset from TransitFeeds is used. Colors of the points represent bus groups. A blue-to-red divergent color of the outer-ring represents the uncertainty, as described in Sec. 3.4. A path for each new data point’s movement is visualized with gradient colors to represent the uncertainties at the corresponding source and target positions.
Section 3.5: Automatic Tracking (related with Fig. 6)
Video 3: An example of automatic tracking. Selected data points with the lasso and new data points are tracked.
Section 4: Performance Evaluation (related with Table. 1)
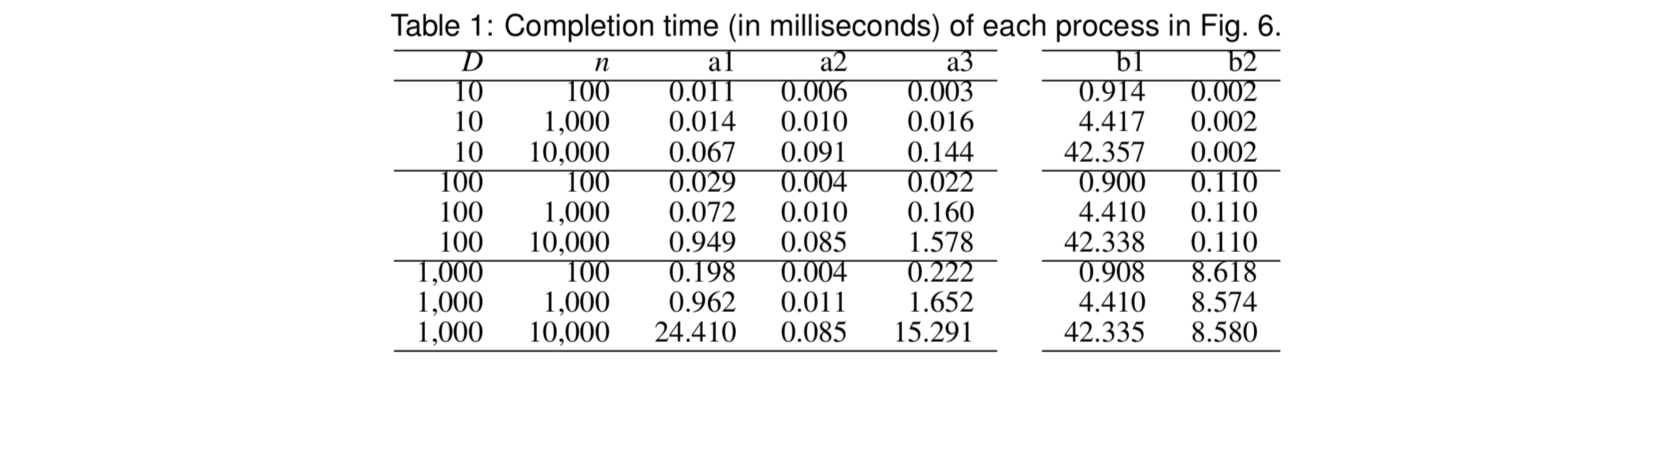
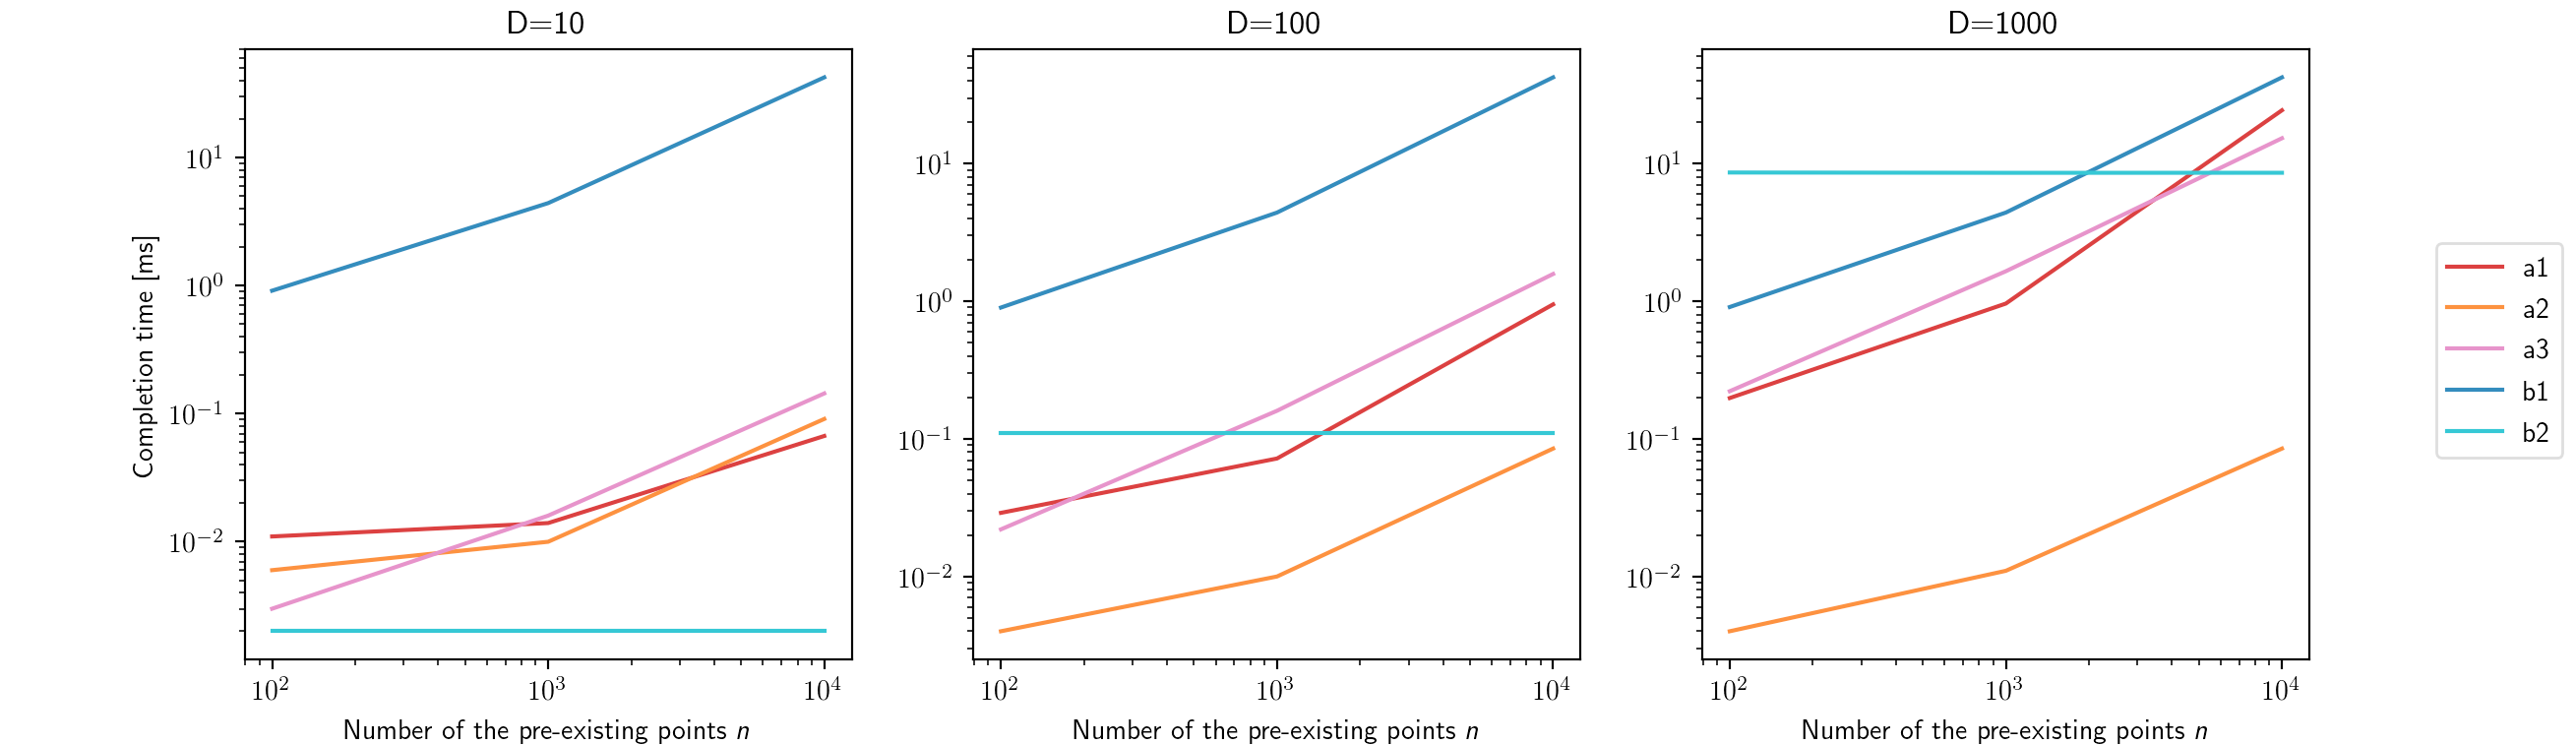
Supplementary Figure 1. Completion time of each process shown in Table 1.